FV Financial Function in Excel – how can I use this financial function in my spreadsheets? Watch the video to learn more
![]() This week’s hint and tip is on the FV financial function in Excel. This looks at the financial function which is applicable to home as well as business use. This isn’t covered in any of our courses so we decided to do a hint and tip on it. We are going to go through it now below.
This week’s hint and tip is on the FV financial function in Excel. This looks at the financial function which is applicable to home as well as business use. This isn’t covered in any of our courses so we decided to do a hint and tip on it. We are going to go through it now below.
This week’s blog on FV financial function in Excel
This week’s video was recorded in Sept 2020 when interest rates across the country are very low and it’s hard to get any interest worthwhile from a bank or building society. So I thought it would be good to see how Excel could be used to compare investments pots of money across different interest rates.
We cover another financial feature in our master class course called Data Scenarios
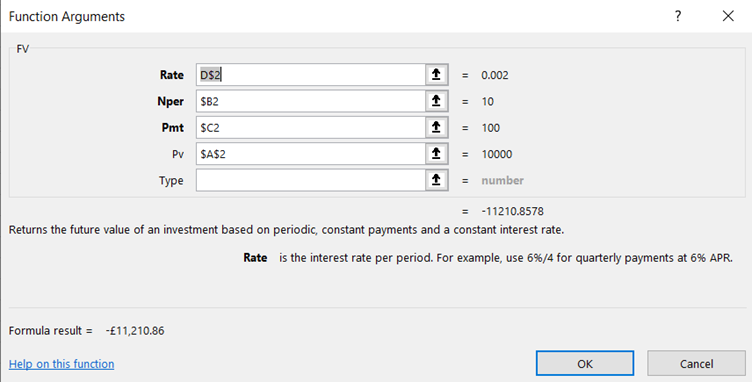
The structure of the FV function used in our video is as follows:

The interest Rate is input as a yearly APR in cell D2 but since we have 3 separate interest rates on row 2 we use an absolute reference D$2 (Rate)
The number of periods is 10 years held in just 1 cell B2 (Nper)
The payment each year is in C2 (Pmt)
The initial investment is held is A2 (Pv)
All of the arguments stated above in bold are mandatory
Why is the answer in the video negative?
In Excel language, if the initial cash flow is an inflow (positive), then the future value must be an outflow (negative). You could always put a -ve before the FV if you wish.
The video below shows you what the FV function does and how you can use it in your spreadsheets in Excel. This feature in Excel can be very useful for working out how much an investment will make.
Take a look below at the video to find out more and then try it out on your own computer!
We hope you have enjoyed this hint and tip on FV financial function in Excel. Why not take a look at our previous one on dependent list type of data validation?
