
Inserting Charts in Word – how can I insert a chart and then format/edit it?
![]() This week’s hint and tip is about how to insert a chart into a Word document. Also covered is how to format the chart once it is inserted. We cover this on our Intermediate Word training course and where this option is found and how to use it. We are going to go through it now below.
This week’s hint and tip is about how to insert a chart into a Word document. Also covered is how to format the chart once it is inserted. We cover this on our Intermediate Word training course and where this option is found and how to use it. We are going to go through it now below.
Inserting a chart in Word
 The option to insert a chart in Word is found on the Insert Tab. To use it, click on the Insert Tab and then along the ribbon, click on the button called Chart.
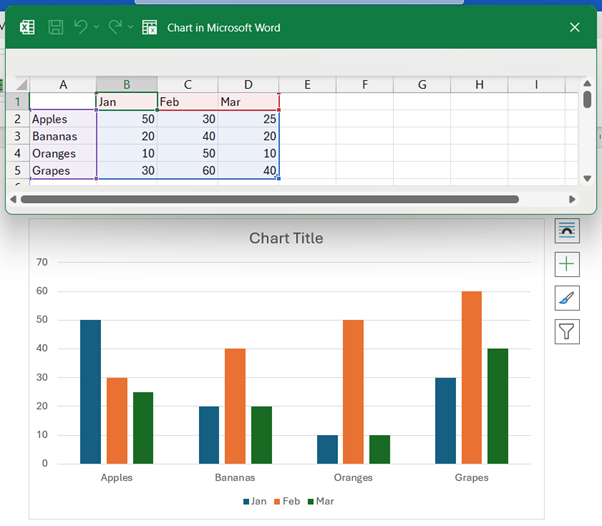
From here a pop up window will appear. Here you can choose the style of Chart you want and click OK. This will then insert a chart into your document and give you an Excel window to amend the data.
Editing/formatting the chart
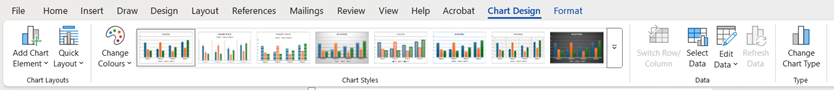
After you have inserted your chart, you get two tabs for editing/formatting. These are the Chart Design tab and the Format tab. The Chart Design tab allows you to change the appearance of the chart through the use of Chart Styles. You can also edit the data and change the chart type from this tab.
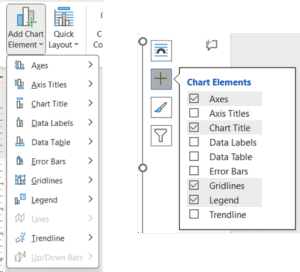
Once your chart is inserted, you can then add Chart Elements to it, e.g. Axis Titles or Data Labels. One way to do this is via the Chart Design Tab and the other way is via the + button in the top right hand corner of your chart. Both these ways will bring up the chart elements options that you can add to your chart.
The video below shows you how to insert a chart into a Word document and how to format or edit it. Inserting a chart into your Word document is a great way to visually display information.
Take a look below at the video to find out more and then try it out on your own computer!
We hope you have enjoyed this hint and tip on inserting charts in Word. Why not take a look at our previous one on how to insert a table in Word?