
PivotTable by Copilot in Excel – how can I use Copilot to create a PivotTable in my spreadsheets?
 This week’s hint and tip is looking at how you can create a PivotTable by Copilot in Excel. We cover PivotTables on our Advanced Excel training course but not how to create one using Copilot. We are going to go through it now below.
Copilot in Excel
Copilot is the AI tool that is available for users in all the Microsoft packages. It can be used for a variety of tasks and there are a number of options it can be used for in Excel.
We have done a previous hint and tip post as a brief introduction to using Copilot. You can find that information here in the hint and tip post.
PivotTable by Copilot in Excel example
We are going to demonstrate the use of the AI tool to analyse and create a PivotTable to summarise the data in a spreadsheet below.
Clicking on the drop down arrow on the Copilot button found on the Home Tab, select the ‘App Skills’ option.
From here a prompt window will appear on the right where you can type in your message with what you want Copilot to do.
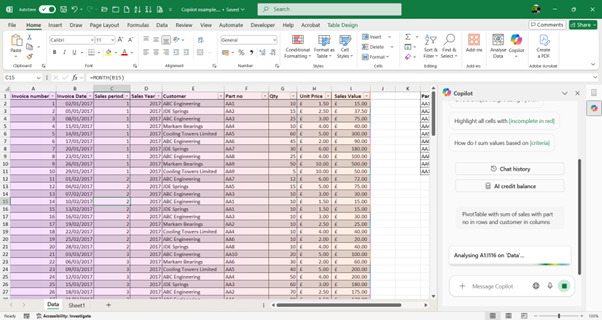
We are typing in the following: “PivotTable with sum of sales with part no in rows and customer in columns”. This produces the following screenshot where it is analysing the data.
Once it has finishing analysing, it gives you the summary in the side pane with the option to ‘Add to a new sheet’. This will insert the PivotTable into the workbook for you.
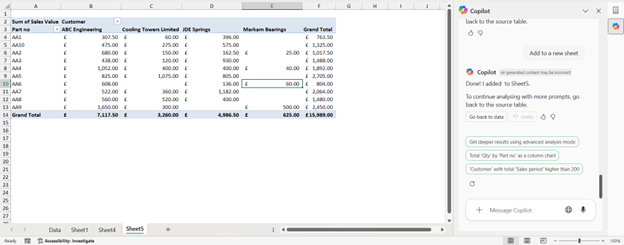
When typing in your message/prompt to Copilot, being more specific and detailed is the key to getting exactly what you require. As we did not mention what to put in the Filters PivotTable field, there is nothing currently there.
PivotTable second example
We are now going to create another PivotTable to analyse the data with a more detailed prompt to show how adding in more information will give you the PivotTable you want.
So, the prompt we are using now is: “PivotTable with sum of sales with part no in rows, customers in columns, sales period and sales year in filters”.
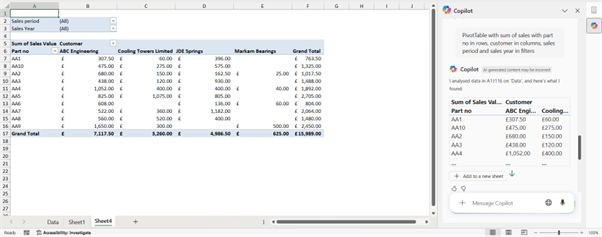
This then produces the PivotTable above which you can see is the same as the previous one except there are now filter options included.
Each time there is then an option to click on the button to ‘add to a new sheet’ so that the PivotTable can be added into your workbook.
The video below shows you how you can create a PivotTable by Copilot in Excel. Copilot can be a good aid tool for a user with some detailed and specific prompts in helping streamline their data analysis.
Take a look below at the video to find out more and then try them out on your own computer!
We hope you have enjoyed this hint and tip on creating a PivotTable by Copilot in Excel. Why not take a look at our previous video hint and tip on a brief introduction to how to use Copilot in Excel?